
What Is Phase Equilibrium
PHASE EQUILIBRIUM IS THE STUDY OF THE EQUILIBRIUM WHICH EXISTS BETWEEN OR WITHIN DIFFERENT STATES OF MATTER, NAMELY SOLID, LIQUID AND GAS. EQUILIBRIUM IS DEFINED AS A STAGE WHEN THE CHEMICAL POTENTIAL OF ANY COMPONENT PRESENT IN THE SYSTEM STAYS STEADY WITH TIME. PHASE IS A REGION WHERE THE INTERMOLECULAR INTERACTION IS SPATIALLY UNIFORM. IN OTHER WORDS, THE PHYSICAL AND CHEMICAL PROPERTIES OF THE SYSTEM ARE THE SAME THROUGHOUT THE REGION. WITHIN THE SAME STATE, A COMPONENT CAN EXIST IN TWO DIFFERENT PHASES, SUCH AS THE ALLOTROPES OF AN ELEMENT. ALSO, TWO IMMISCIBLE COMPOUNDS IN THE SAME LIQUID STATE CAN COEXIST IN TWO PHASES.
Phase equilibrium has a wide range of applications in industries, including
- Producing different allotropes of carbon
- Lowering the freezing point of water by dissolving salt (brine)
- Purification of components by distillation
- Usage of emulsions in food production, pharmaceutical industry, etc.
Solid-solid phase equilibrium has a special place in metallurgy and is used to make alloys of different physical and chemical properties. For instance, the melting point of alloys of copper and silver is lower than the melting point of either copper or silver.
To top it off, the aerospace sector uses phase balancing to improve the stability and performance of rocket boosters and fuels. Not only that, it improved the efficiency and durability of advanced materials to improve their durability and efficiency and make them optimal for use in the construction and energy industries.
Phase diagrams
Phase diagrams are used to understand the relationship between different phases and are usually represented as the change in the phase of a system as a function of temperature, pressure, or composition of the components in a system. The system exists in a phase where the Gibbs free energy of the system is least.
At equilibrium, the temperature, pressure, and chemical potential of constituent component molecules in the system have to be the same throughout all the phases. Figure 1 gives a general schematic of a phase diagram of a single component system (Lue, 2009).
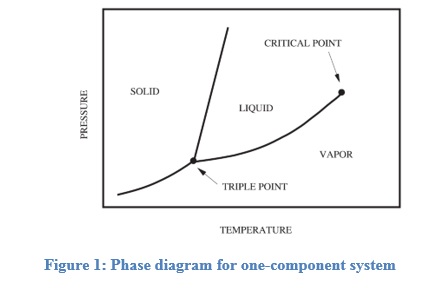
The curves shown in the figure represent the coexistence of two phases. The melting curve is the curve in the phase diagram along which the solid and liquid phase of a system stays in equilibrium. The liquid and gas phases remain in equilibrium along the vaporization curve.
The sublimation curve represents the equilibrium stage between the solid and gas phase.
The triple point is a point on the graph where all the three states coexist and is unique for every component. If α and β are any two phases in which a component can exist, by using the first and second law of thermodynamics, the slope of any of the curves in figure 1 can be represented by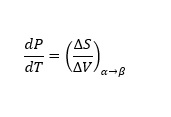 (1)
(1)Where P and T are the pressure and temperature of the component, respectively. ΔS and ΔV are the changes in molar entropy and molar volume, respectively of the component when it changes its phase from α to β at equilibrium.
Equation (1) can also be written as
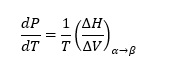 (2)
(2)Clausius Clapeyron
The above is referred to as a Clausius Clapeyron equation. The vapor pressure in equilibrium refers to the number of molecules evaporating is equal to the number of molecules condensing on the water surface. According to Gibbs phase rule about multi-component systems, the number of intensive degrees of freedom in a non-reactive multi-component system, F at equilibrium, is given by
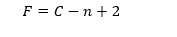 (3)
(3)Where C is the number of non-reactive components in a system and n is the number of phases.
For example, there are two intensive degrees of freedom for two-component and two-phase systems, namely either temperature, pressure, or mole fraction. In other words, in the case of a two-component and two-phase system at equilibrium, there are only two intensive variables needed to determine the thermodynamic state of the system.
Types of Equilibrium
There are four kinds of equilibrium studied in detail are
- Liquid-vapor
- Liquid-liquid
- Solid-liquid
- Solid-solid (alloys or allotropic forms)
An increase in the number of components, chemical reactions, surfactants, and deviation from ideal behavior causes the enhanced complexity of phase diagrams. Here, we have discussed a special case of vapor-liquid equilibrium commonly used in distilleries, i.e., ethanol-water mixtures.
Vapor-Liquid equilibrium
Raoult’s law states that partial vapor pressure exerted by a component in an ideal solution is the product of its mole fraction and vapor pressure of a pure component. Thereby, total vapor pressure exerted by an ideal solution with k components, P is given by
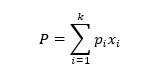 (4)
(4)Where pi is the vapor pressure of the pure component and xi is the respective mole fraction. For instance, if in a brine solution (two-component mixture), one component(common salt) has negligible vapor at the specified temperature. The mixture’s vapor pressure is simply a product of the mole fraction of water and vapor pressure of water at the specified temperature.
Raoult’s law is only valid for ideal solutions, assuming no intermolecular interaction between components. In most cases dealt with in industries, ideal solutions are uncommon. Modified Raoult’s law is used for non-ideal solutions(J.M. Smith, 2005); accordingly, the total pressure exerted, P is expressed as
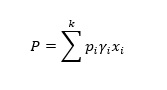 (5)
(5) Yi is the activity coefficient for the ith component.
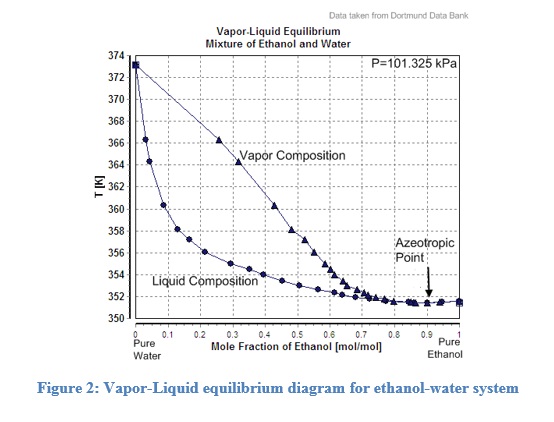
Figure 2 shows the phase diagram for ethanol-water mixtures(Dortmund Data Bank). Similar graphs are used in distilleries to calculate the desired temperatures for specific outlet compositions. It contains a vapor curve and a liquid curve that is used to estimate the vapor or liquid compositions. The vapor curve is also called the dew point curve, while the liquid curve is called the bubble point curve.
Interestingly, the curves meet each other at their lowest point, suggesting that if the electric boiler heater boils the ethanol-water mixture further, it will have the same composition in the vapor phase. Therefore, the maximum ethanol concentration obtained by a simple distillation process in an ethanol-water mixture would be 95.5%.
Azeotropes
These mixtures have the lowest and highest boiling points on the phase diagram. They cannot be purified further and are called Azeotropes.
Azeotropes have higher or lower boiling points than their constituent components, depending on whether the mixtures have a positive or negative deviation from Raoult’s law, respectively.
In the case of three-component or three-phase systems, triangular graphs with three endpoints of the triangle represent the three pure components (phases).
References
Dortmund Data Bank.
J.M. Smith, H. V. (2005). Introduction to Chemical Engineering Thermodynamics. New York: McGraw Hill.
Lue, L. (2009). Chemical Thermodynamics. Leo Lue & Ventus publishing APS.