
Defeating the Duck Curve
Guest Post: Kyle Petitt
Renewable energy technologies have historically struggled to compete with fossil fuel energy production. Renewables provide clean, carbon emission-free energy production. But, until recently, have been more expensive to produce and maintain than their petroleum-based counterparts [1].
Renewable Energy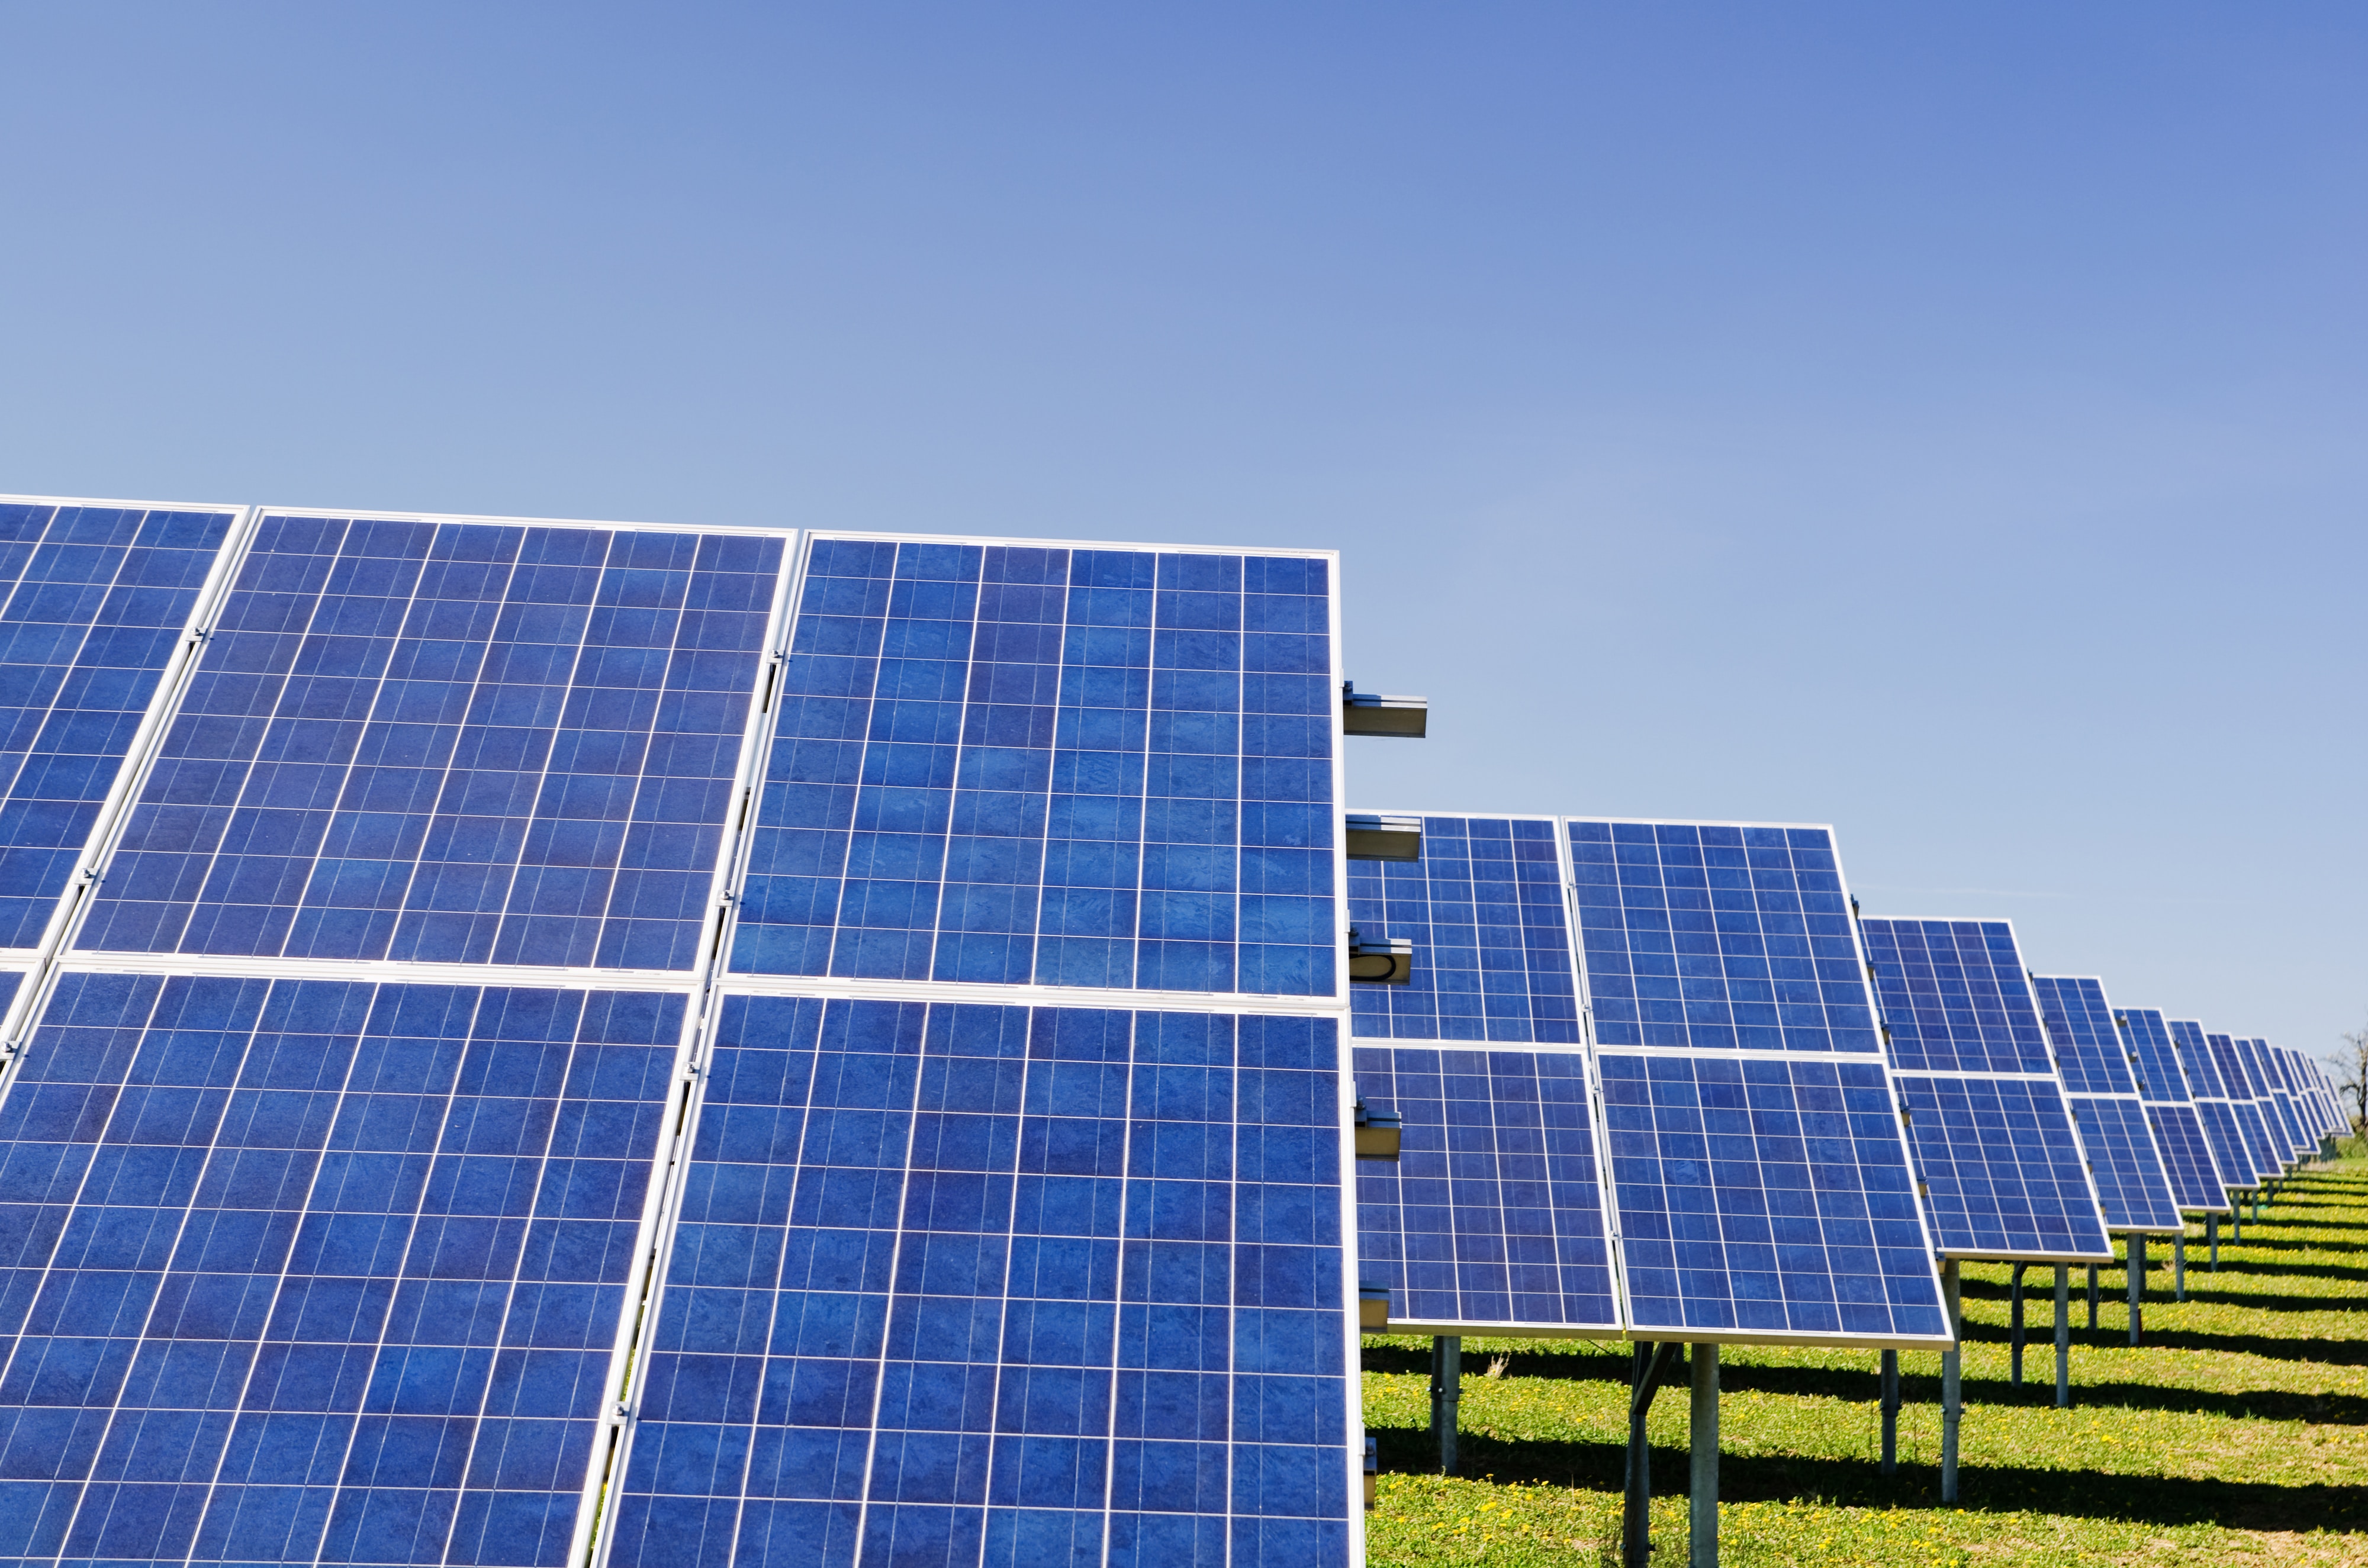
Each method of renewable energy production has its own challenges. Existing fossil fuel infrastructure is expensive to replace. Yet, with current technological advancements, societal pressure, and government subsidies, the world is moving towards a greener future.
Photovoltaic Production vs Consumer Energy Demands
Photovoltaic energy production, or solar energy, is one of the most promising renewable energy sources. It is also the most abundant energy source on the planet [2]. Like other renewable energy sources, however, it has its limitations.
In this case, the biggest limitations are availability and consistency. The sun rises and sets producing different amounts of energy throughout the day and depending on the weather.
In most regions, there are long periods with no photovoltaic energy production. During the day maximum production peaks at midday as shown by the gray line in figure 1. In addition to this, consumer power demands fluctuate throughout the day. These power demands typically follow consistent patterns based on date and time. This allows power companies to predict how much power they need to produce to keep up. For example, there is minimal usage in the middle of the night and maximum usage around sunset (as shown by the blue line in figure 1).
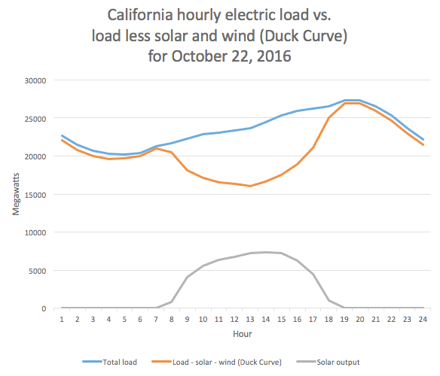
Figure 1: Shows a comparison of consumer energy use and solar energy production [4]
What is a duck curve?
Incorporating photovoltaics into a power grid lowers the total amount of supplementary energy that needs to be produced but complicates production rates throughout the day. The required supplementary energy production is shown by the orange line in figure 1. The odd shape which this forms is the “duck curve.”
Why are duck curves bad?
Incorporating photovoltaics complicates power production rates throughout the day. Instead of following a predictable, daily pattern of energy production, power companies now have to account for photovoltaic production on a day-to-day basis including unpredictable weather effects. This causes two main problems. The first of which is that some power grids aren’t flexible.
Consumer power consumption hits its peak just as photovoltaic production cycles down. This causes a steep increase in demand for supplementary power production. Some grids with older infrastructure struggle to ramp up energy production fast enough to keep up with this demand [5].
To make matters worse, the wider usage of photovoltaic technologies exacerbates the problem. The total photovoltaic production will increase leading to an even steeper increase in demand for supplementary energy at sunset as can be seen in figure 2. The second major issue with the duck curve is the possibility of overproduction.
Most power plants need to operate continuously to remain cost-effective. This means these power plants produce a minimum amount of energy. If the sum of this minimum energy production and the amount of photovoltaic energy being produced is greater than the energy demands of the customers, then the grid is overproducing.
Without anywhere for this energy to go, the grid is at risk of damage or overloading [3]. Redirecting energy to storage or waste systems, or turning off a portion of the photovoltaic cells can prevent overproduction.
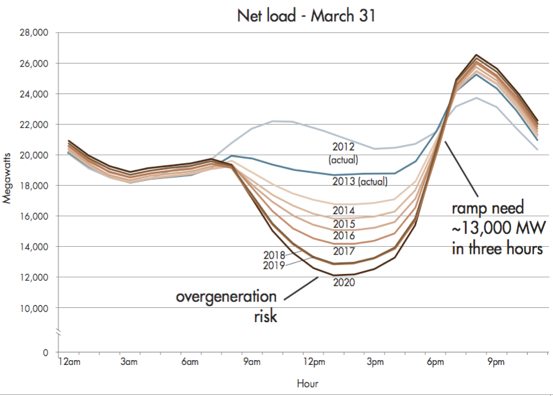
Figure 2: Shows the predicted duck curve in California from 2012-2020 [4]
What can we do to defeat the duck curve?
The duck curve is the largest hurdle preventing the advancements of photovoltaics, but there are strategies to mitigate duck curve causes and effects.
The most promising, and probably most obvious strategy, is to store any excess energy for later use. This energy can be stored in many forms. With recent advances in battery technologies, the price of lithium-ion batteries has greatly decreased [6] making short-term battery storage cheap and effective. By storing energy in batteries, the energy is readily available in the form of electricity and can be distributed as needed.
Energy can also be stored in thermal energy storage systems where it can be used for heating water or air for domestic or industrial use thus reducing the amount of energy needed to heat it to its desired temperature.
Also read: Coalescer Skid Systems for Oil & Gas Applications
Decreasing the sudden energy demands at sunset would also help to mitigate issues brought on by the duck curve. When the sun sets, people turn on the lights. For example, switching to LED light bulbs, which are more energy-efficient, consumer energy demands can be decreased.
Another duck curve mitigation strategy is to diversify energy production methods. Incorporating multiple energy generating technologies decreases the shortcomings of any single method. For example, incorporating 15% photovoltaic and 15% wind energy generation into the energy production strategy instead of 30% photovoltaics would smooth the features of the duck curve and lower the risk of overproduction.
One theoretical strategy that is often proposed is to increase the size and scale of individual power grids and combine them across large geographical areas to increase the period over which photovoltaic energy can be produced. This way the excess energy can be distributed where it’s needed when it’s needed. A theoretical worldwide power grid would always have access to sunlight and therefore photovoltaic energy.
The duck curve is the single largest hurdle in the pursuit of a photovoltaic-based energy system. Fortunately, as technology and mitigation strategies advance, the duck curve becomes more manageable.
References
[1] https://news.energysage.com/solar-energy-vs-fossil-fuels/
[2] https://www.energy.gov/articles/top-6-things-you-didnt-know-about-solar-energy#:~:text=6.,the%20world’s%20total%20energy%20use.
[3] https://www.vox.com/energy-and-environment/2018/3/20/17128478/solar-duck-curve-nrel-researcher
[4] http://www.caiso.com/market/Pages/ReportsBulletins/RenewablesReporting.aspx
[5] https://www.energy.gov/eere/articles/confronting-duck-curve-how-address-over-generation-solar-energy